Flu Forecaster
Predicting influenza sequence evolution using deep learning.

by Eric J. Ma, Insight Health Data Science Fellow, Boston Summer Session 2017
Summary
In this project, I combine the use of Variational Autoencoders (VAEs) and Gaussian Process (GP) regression to forecast what influenza protein sequences will look like six months ahead.
In this project:
- VAEs transform discrete sequence to a continuous representation.
- We use GPs for time-series regression to forecast future continuous space representations of flu.
- We then take the forecasted representations, and pass them back through the VAE to get back predicted sequences.
Source code for this project can be found on GitHub.
Predicted Sequences
Given the current evolutionary trajectory of the influenza A virus, there are 16 distinct predicted "average" influenza hemagglutinin sequences for the coming quarter.
Problem
Influenza vaccine strain selection lags behind deployment by about 6 months to 2 years, while production lags behind deployment by about 6 months. Additionally, vaccine strains are selected from amongst currently-circulating strains.
This means that the flu virus will have evolved by the time the vaccine strain is scaled into production.
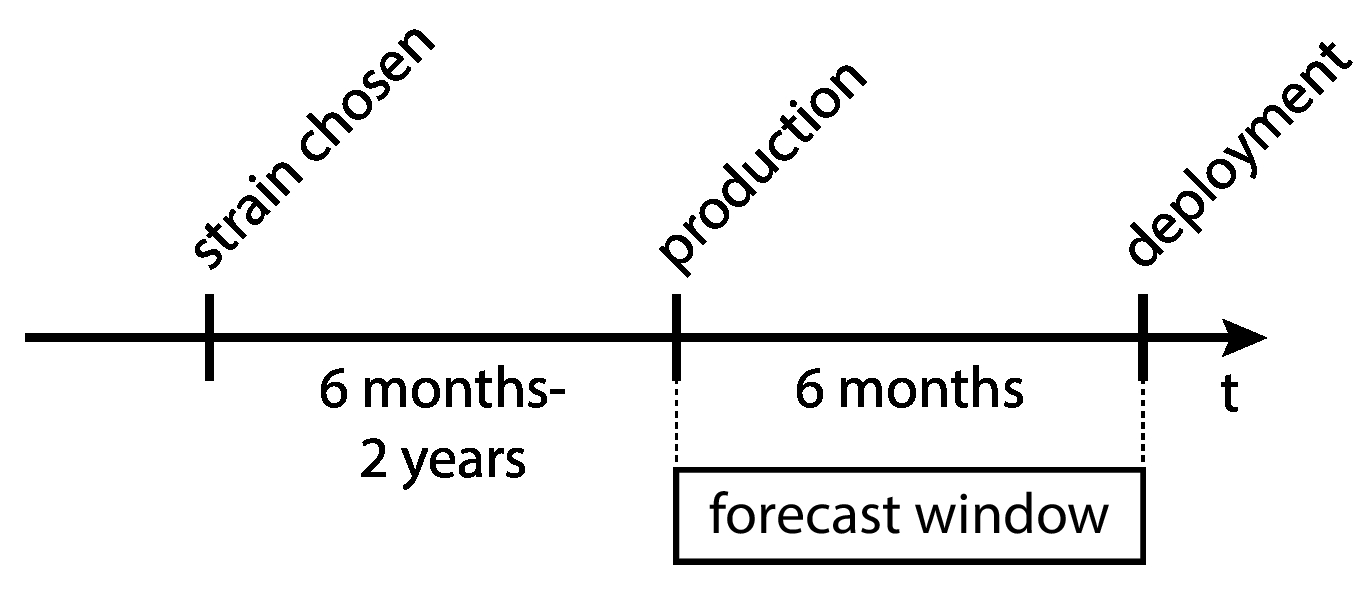
Large lag time from vaccine strain selection to actual deployment.
There is a lost business opportunity here, as studies by the CDC are showing that the 2017 vaccine efficacy is below 50% on most years, with some years dropping to below 20% efficacy. Sustained lack of efficacy may result in a lack of public confidence in vaccination. The most immediate impact would be a contraction in the market for vaccines, followed by adverse impacts for public health. With a USD 4 billion dollars market size globally, vaccine manufacturers cannot afford for public confidence to be eroded.
Good science can help make vaccines that better match what will actually be circulating, which is good business sense, and that is the goal of this project.
Data
The data are sourced from the Influenza Research Database, a publicly-hosted repository of influenza sequencing data. Each virus that is sequenced is geographically- and time-stamped. The data I collected span the years 2000-2017. I only downloaded hemagglutinin (HA) protein sequence, because it is the protein most determinant of an immune response; if the vaccine strain's HA sequence is similar to the circulating strain's HA sequence, then it will provide protection against the circulating strain.
There are multiple subtypes of influenza; some you may have heard include "H1N1", "H3N2" and "H5N1". I focused only on H3 hemagglutinin protein sequences sourced from human patients worldwide. In total, there are 14455 influenza sequences considered in the dataset.
Analysis Methods and Tools
Data Preprocessing
Variational Autoencoders
Gaussian Process Regression
Sequences were padded with * (asterisk) characters to the maximal length. They were then one-hot-encoded at each position, yielding a sparse binary matrix representation of each protein's amino acid sequence. Of the 18 years of data used, 17 years (2000-2016) were part of the training set, and the final year (2017) was held out for forecasting validation.
Data Preprocessing
Sequence Padding
Contrary to what might be common thought, multiple sequence alignment was not done prior to conversion to a numerical form. Rather, I first computed the maximum sequence length represented inside the set of sequences downloaded, and padded * (asterisk) characters on each sequence until all of them fit that length.
This done using custom Python code and the BioPython and numpy packages.
One-Hot Encoding
Sequences were then one-hot encoded at each position. Memory was not an issue, and as such each amino acid position was converted into 24-long vector, with one slot in the vector per canonical amino acid, three more for ambiguous a.a. (B, J, X), and one for the padding character ("*"). Each vector slot represents an amino acid letter. A "1" is placed in a slot if the amino acid at the currently considered position corresponds to that slot's letter, and a "0" is placed everywhere else.
This was accomplished using the sklearn.preprocessing module.
Validation Set
In time series analysis, data cannot be held out at random. This is because there's potentially "autocorrelation structure" in time-series data - the value of a data point at time "x" may depend on the value of a data point at time "x-1".
For the sake of computational efficiency, I first downsampled sequences to their mean sequence per quarter, and performed time-series regression on this downsampled dataset. Improvements to this are addressed below the evolutionary trajectory plots.
Here, I held out the last two calendar quarters of data, corresponding to data from the first two quarters of the year 2017.
This done using custom Python code and the pandas package.
VAEs were used to learn a continuous latent embedding/representation of the binary encoded protein sequence on which a Gaussian Process regression model could be used for forecasting. It learns a generative model of sequence space, allowing us to sample new sequences out of forecasted latent space.
Variational Autoencoders
Autoencoders reconstruct the input as the output, and simultaneously learn a lower-dimensional "latent" representation of the original data. With sequences, this has the advantage of converting a "discrete" input into a "continuous" one; with continuous representations, we have a wealth of regression methods that can be used that would not otherwise be available using protein sequences. The encoder portion of the network compresses the data to the latent embedding, and the decoder network reconstructs sequences from latent embedding coordinates.
"Variational" autoencoders learn not just the "point estimate" in "latent embedding space", but also the probability distribution in "latent embedding space" that corresponds to a particular sequence. This means that we can also sample new sequences out of the latent space, and generate new, unseen sequences. This gives us hope for forecasting what new sequences will look like.
Here, after converting the sequences to a binary encoding, I passed the binary-encoded matrix through a VAE to learn a 3D embedding, which you can visualize below.
Basically, VAEs give us a convenient representation of sequence space that lets us do other machine learning on it.
Variational Autoencoders were implemented using the Keras package.
Gaussian Processes were used to forecast the latent embedding coordinates for future influenza sequences. The forecasted coordinates were passed back to the decoder portion of the VAE to provide the probability distribution over possible sequences.
Gaussian Process Regression
Gaussian Processes are a "lazy" and Bayesian machine learning method well suited to learning non-linear functions of data. The basic idea behind GPs is as such: given a set of data points sampled from a non-linear function, it will return a probability distribution over the possible functions that fit the dataset. GPs are called "lazy" because they assume that points nearby one another on one axis will be nearby one another on the other axis.
In time-series land, GPs are particularly useful because time-series data may be varying in a non-linear fashion with time (think stock markets), and they are able to provide quantified estimates of uncertainty in predictions (because they're Bayesian - Go Bayes!).
Basically, GPs provide a way of quantifying the uncertainty surrounding predicted sequences.
GPs here were implemented using PyMC3.
Evolutionary Trajectory
Read on to see how to interpret the scatter plots below.
Time-varying Evolution
Using a variational autoencoder, we can visualize the evolutionary trajectory of viral proteins in lower dimensions. In Flu Forecaster, I have chosen to visualize them in 3 dimensions. Because 3D visualizations are difficult in the browser, I have decomposed the plots to show pairs of dimensions at a time.
Each point in the scatterplot below is a representation of the "median" flu sequence per calendar quarter. The points are coloured by time - dark colours are earlier (starting at the year 2000), and light colours are later (ending at the year 2016).

Forecasted Sequences
Forecasted sequences are visualized using bounding boxes. Each bounding box represents one sequence, and they are coloured differently. In 3D space, each unique sequence takes up a "volume"; sequences with larger "volumes" (or areas in the 2D projection) have larger forecasted probability of showing up. The uncertainty in the forecasts are thus represented by the probability distribution over possible discrete sequences. In other words, we don't forecast one sequence, but a set of sequences. For visual simiplicity, only those sequences with a greater than 2.5% probability of showing up are shown.
Improvements
Data-driven science is never really done. Here's how I think this project can be taken to the next level.
Forecasting Diversity
Right now, Flu Forecaster predicts forecasted sequences one quarter out, and only predicts the "median sequence" that we expect to see. This "median" sequence actually differs from other-circulating viruses by anywhere from 6-19 amino acids, and the other protein sequences represent the diversity/variance of amino acid sequences possible. In order to accomplish this, I would have to train both the mean and the variance in each coordinate dimension, and jointly sample coordinates using both the mean and variance.
GP Training
The Gaussian Process coordinate dimensions are trained independently. It may be better to train the GP on all 3 dimensions jointly, though experimentation would be needed to determine whether increased computational complexity would be worth the accuracy.
Validation
More work needs to be done on backtesting. Currently, I am doing model validation by checking that the 2017 "average" coordinates fall within the 95% HPD of the latent space coordinates. I have yet to perform more periods of backtesting, in which I hold out more than just two quarters of data.
Conclusions
Forecasting how sequences evolve is a tough problem, primarily because there's no notion of "forward momentum" when talking about changes in sequence land. However, if we transform the problem into one involving a "continuous" representation, we can take advantage of concepts like momentum vectors and gradients, and harness tools from continuous time-series regression.
Author Info
Eric obtained his ScD (Doctor of Science) degree from the Department of Biological Engineering at MIT in 2017. He is an avid open source fan, and believes in the Bassist's philosophy: do important work and pace the team behind the scenes, and step up front only when necessary. His personal website can be found at www.ericmjl.com.